Motif analysis by meme and visualize in R
This article provides a comprehensive guide on motif analysis using the MEME suite and visualization in R, using both the MEME web tool and its local version, and concluding with motif visualization using R packages like universalmotif, motifStack, and ggseqlogo.
1. prepare data
library(readxl) # read_xlsx
library(dplyr) # process data
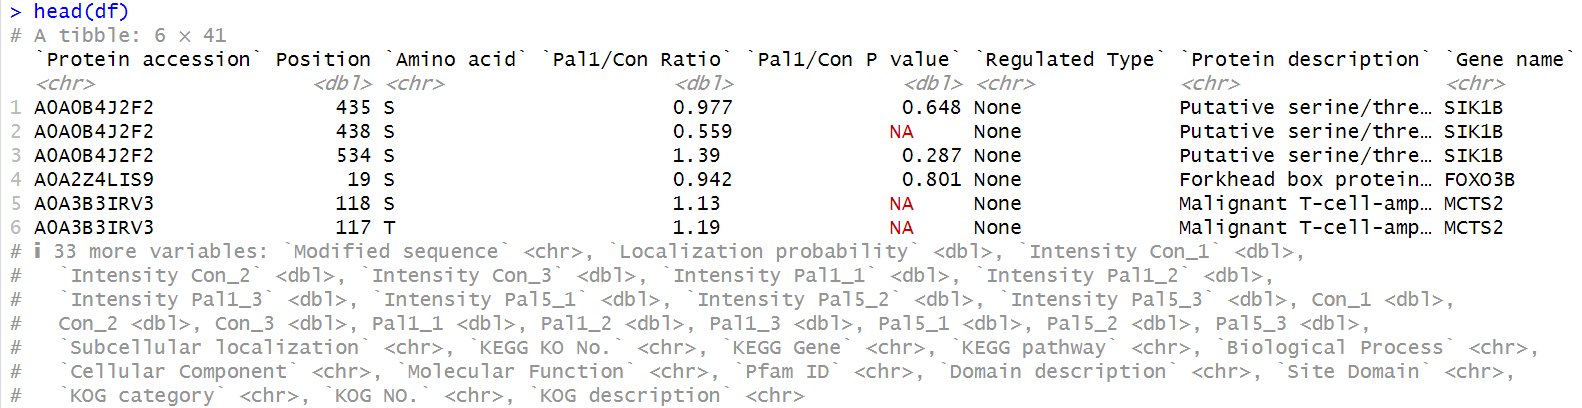
data <- read_xlsx("input/Differentially_annot .xlsx", sheet = 1)
# extract seq
df <- data %>%
mutate(`Modified sequence` = `Modified sequence` %>%
gsub("^_", "", .) %>% # 去除首部的 _
gsub("_$", "", .) %>% # 去除尾部的 _
gsub("\\[.*?\\]", "", .)) %>% # 去除 [] 及其内容
filter(nchar(`Modified sequence`) >= 8) # meme 需要输入序列长度大于8
# Add data filtering
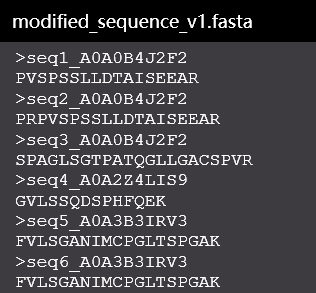
save as fasta
# save as fasta
writeLines(paste0(">seq", 1:length(df$`Modified sequence`),"_", df$`Protein accession`,  "\n", df$`Modified sequence`),
           "modified_sequence_v1.fasta")
2. find motif by meme
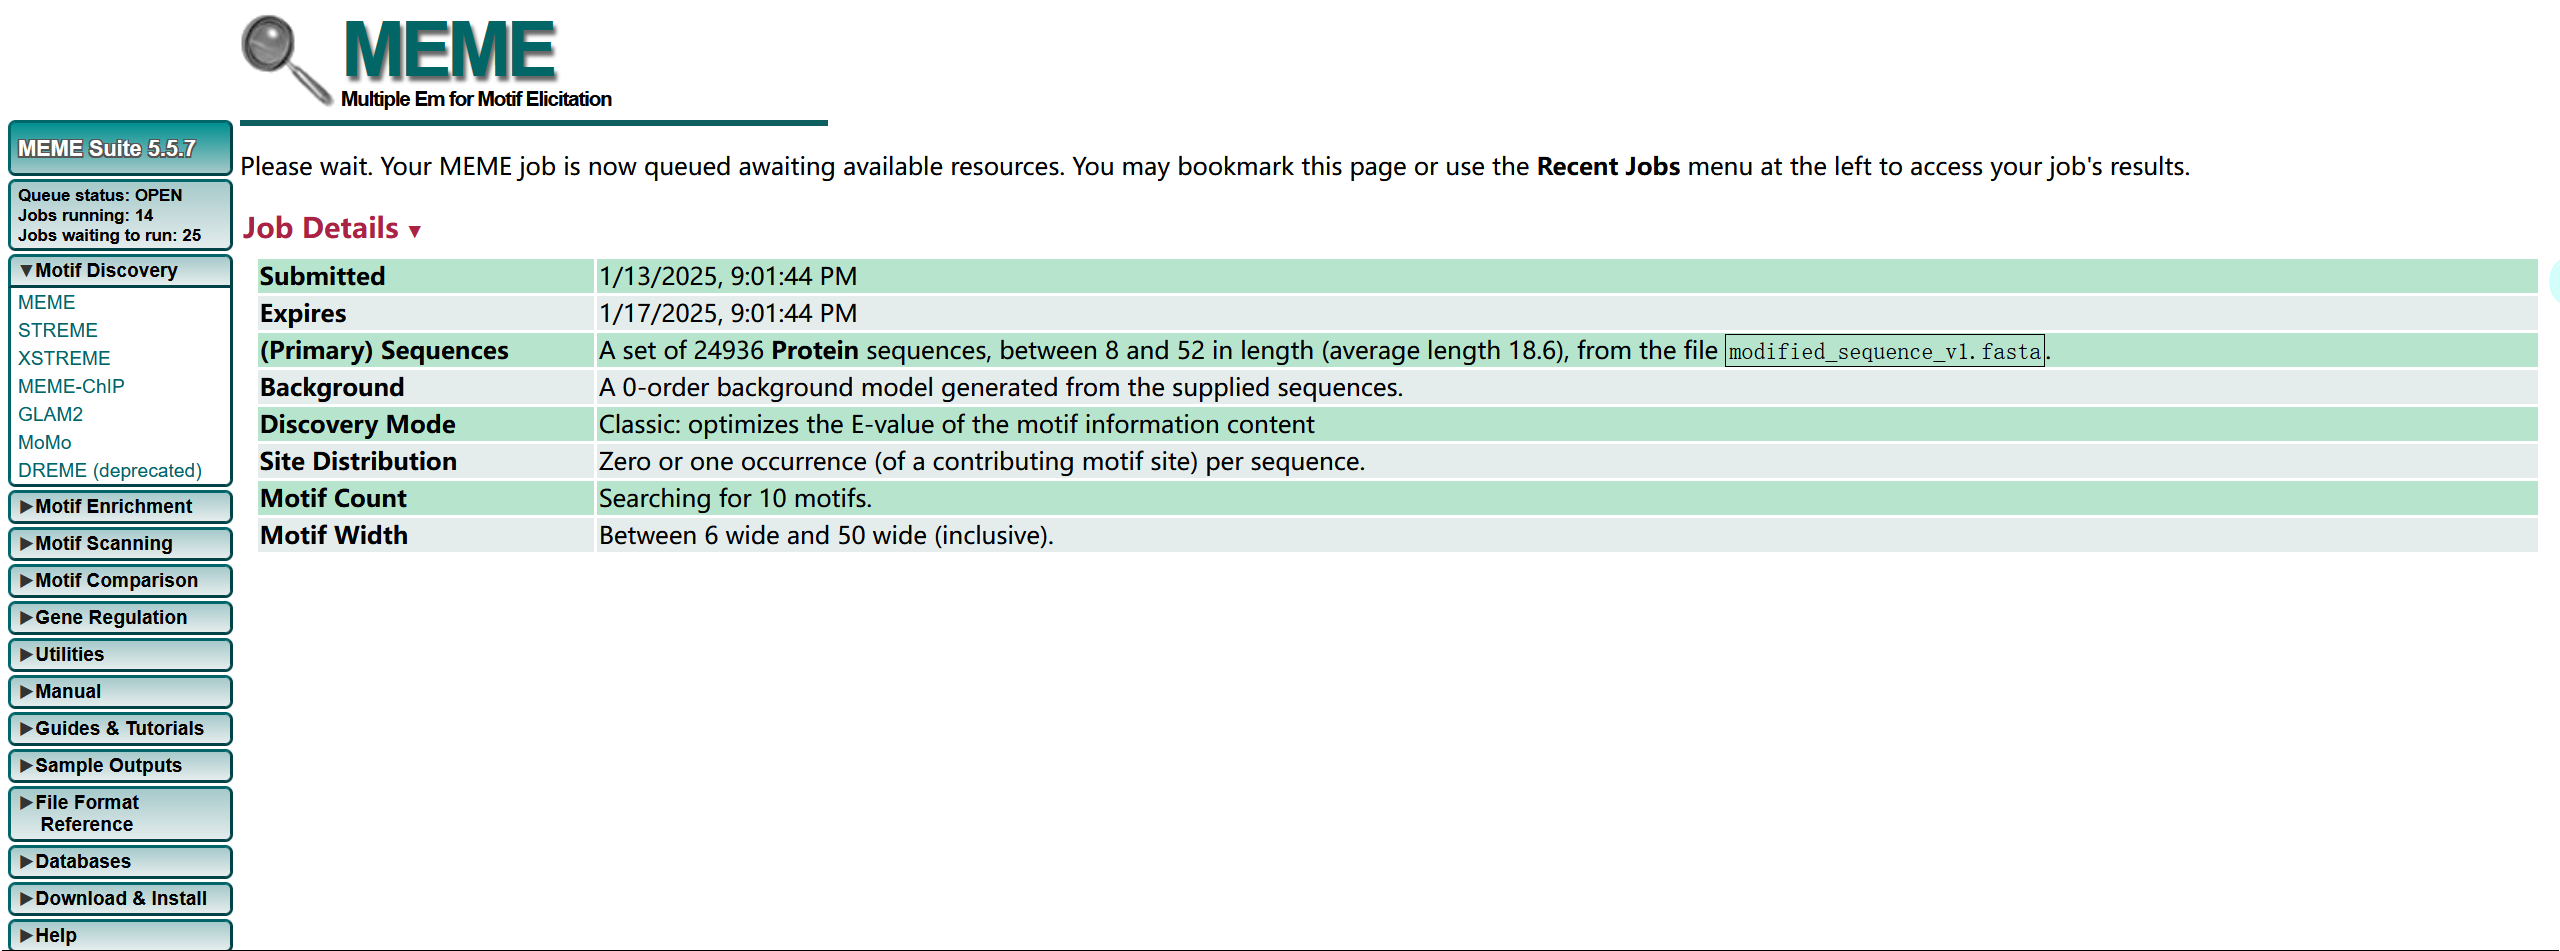
method 1: use meme web
find motif in meme: https://meme-suite.org/meme/tools/meme
params description:
mod zoops motif的分布类型
- oops 每个功能域在每一段序列中都会出现一次,而且只出现一次。这种模式是运算速度最快,而且最为敏感的。但是如果并不是每个序列都包含功能域,那就可能会有不正确的结果。
- zoops 每个功能域在每一段序列中至多只出现一次,可能不出现。这种模式运算速度较快,敏感性稍弱。
- anr 每个功能域在每一段序列中出现的次数不定。这种模式运算速度最慢,可能会多花十倍以上的时间。但是对于功能分布的情况完全未知的情况下,这一参数可能会有帮助
Select the number of motifs
决定在这一组多条序列中,将被挖掘出的结构域(motif)的种类数量。默认值是3,这意味着在这一组序列中,发现的motif的数量最多3个。但有时候,我们无法预先了解这组序列实际上的结构域的数量,那么可以先填写一份较大的数值。例如10。在完成分析后,再查看分析结果中结构域的显著性。例如,如果结果中保守性达到显著水平(P<0.05)的结构域数量是6。那么,则可以将最初的参数从“10”修改为“6”,然后重新提交数据分析一次。
Wait after commit

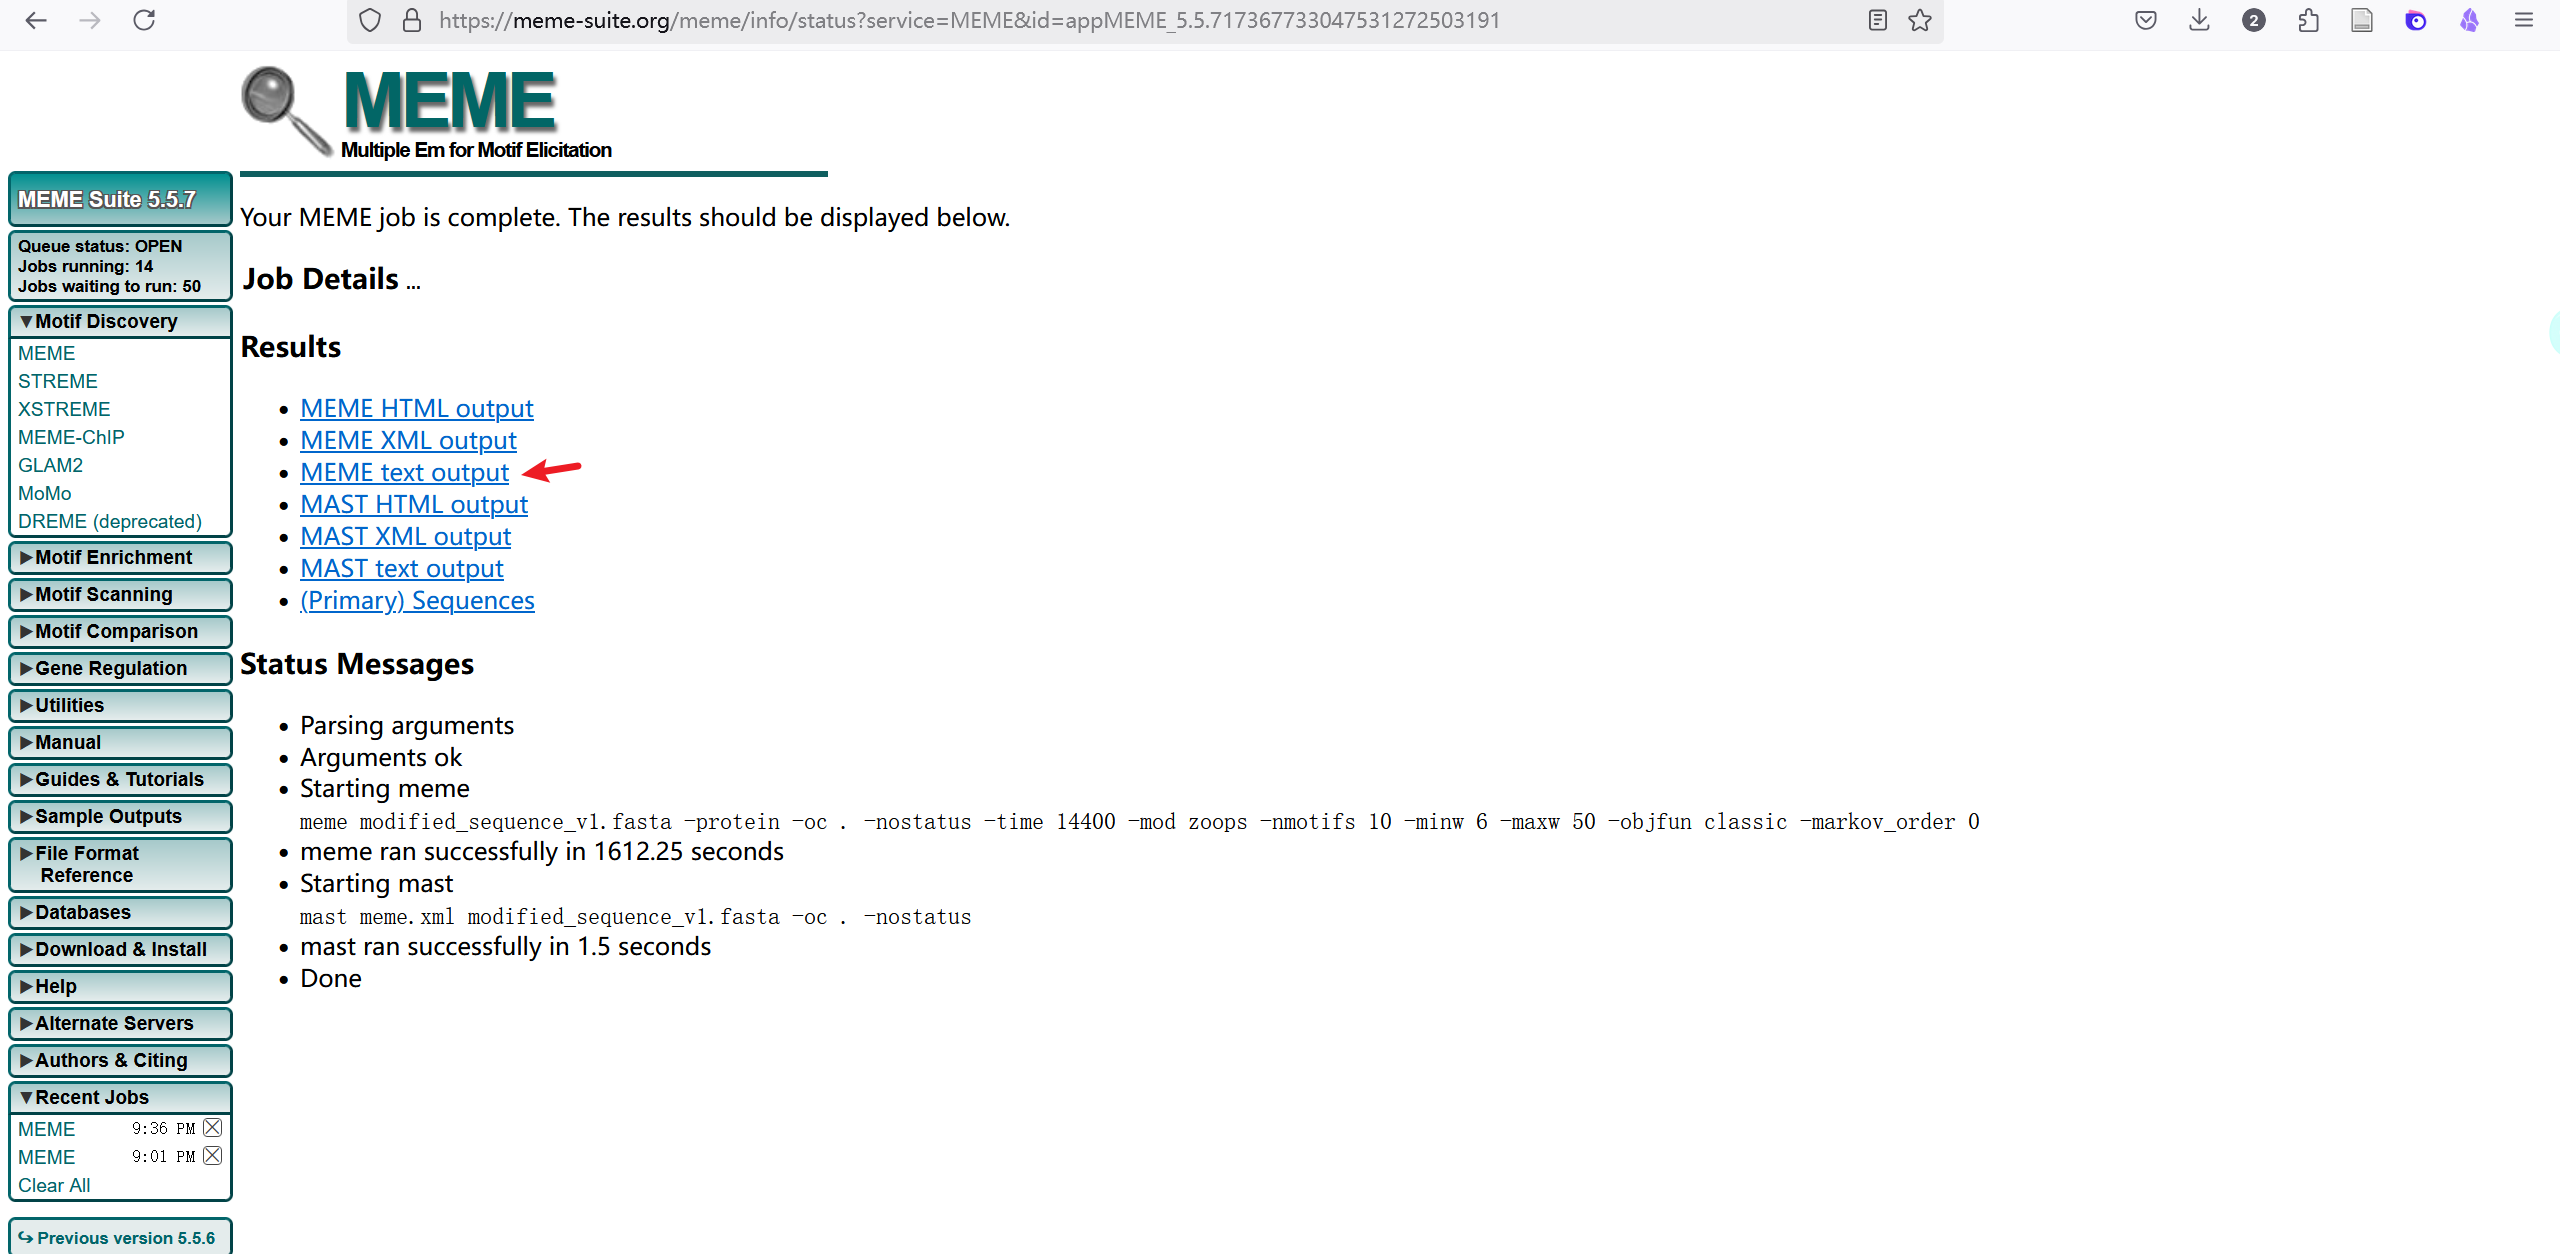
Download result meme.txt as downstream input
method 2: use local meme
To avoid queues, you can also download the local version of meme to search for motif
install meme
conda create -n meme -c bioconda meme -y
conda activate meme
find motif by meme
meme modified_sequence_v1.fasta -o meme_v1 -minw 6 -maxw 50 -mod zoops -nmotifs 10
result
Use meme.txt as downstream input
3. visualization in R
Load the output file meme.txt of meme
#load motif
BiocManager::install("universalmotif")
library(universalmotif) # read_meme
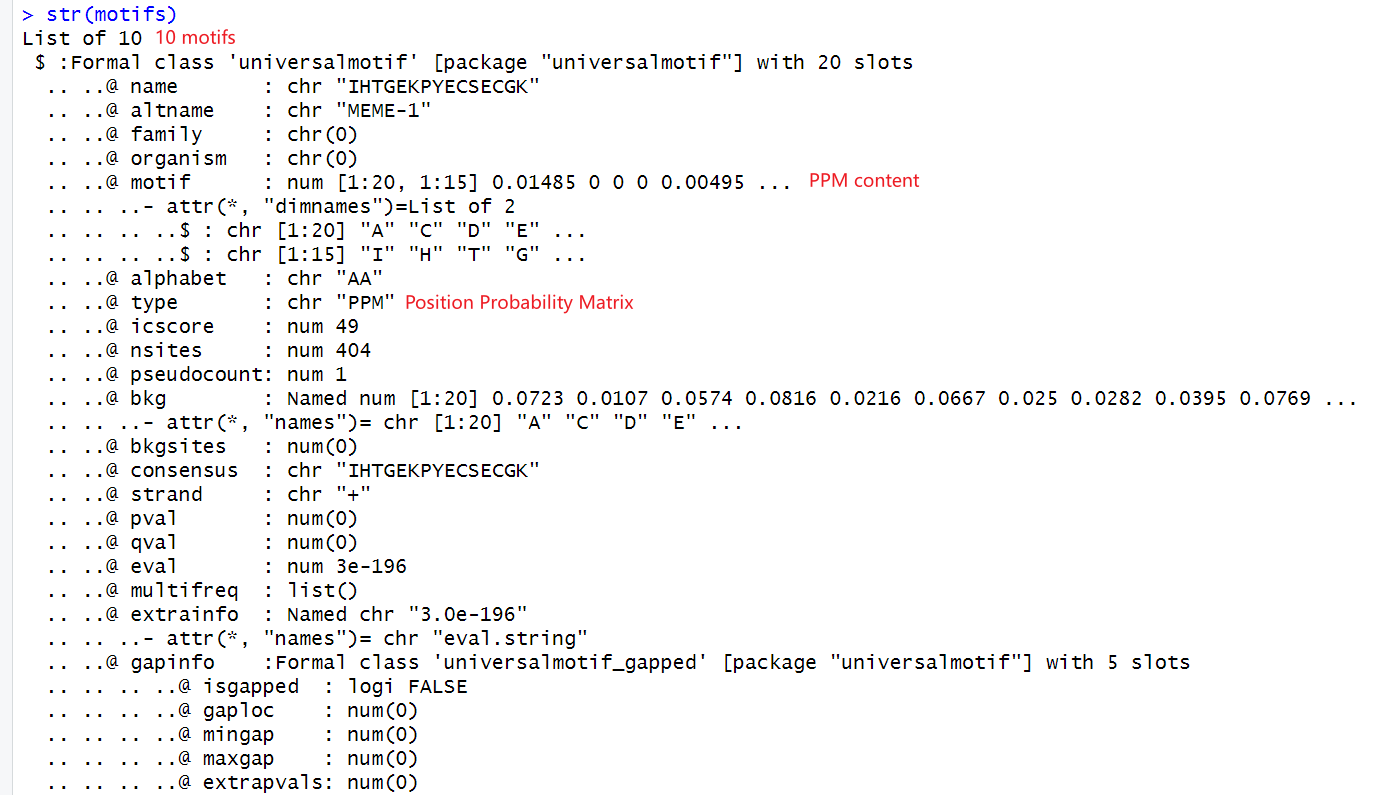
motifs <- read_meme("meme.txt", skip = 0, readsites = FALSE, readsites.meta = FALSE, readsites.meta.tidy = FALSE)
The motif is structured as follows:

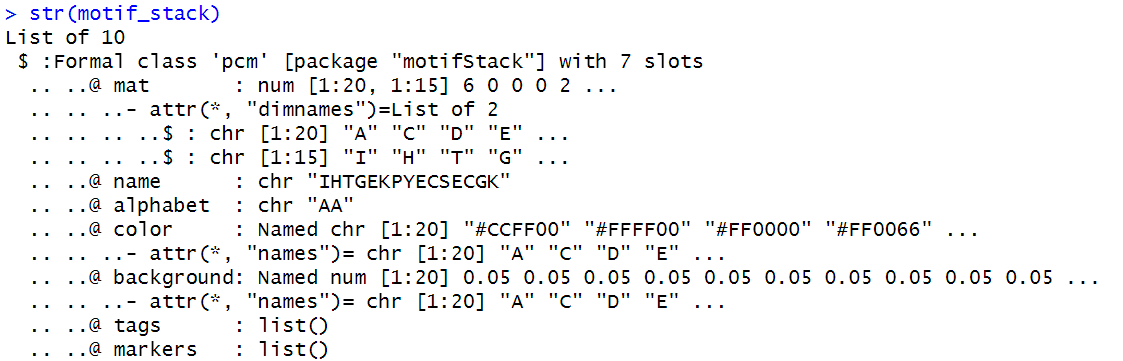
3.1 Visualization via motifStack
Organize the input format required for motifStack
# 提取 PPM 并转换为 pcm 对象
motif_stack <- lapply(motifs, function(m) {
  # 提取 PPM 矩阵
  ppm <- m@motif
  # 将 PPM 转换为 PCM
  pcm <- ppm * m@nsites
  # 创建 pcm 对象
  new("pcm", mat = pcm, name = m@name)
})
visualization
pdf("motif_stack.pdf", width = 8, height = 8)

# plot
motifStack(motif_stack, layout = "stack", ncex = 1.0) # layout = stack / tree

dev.off()
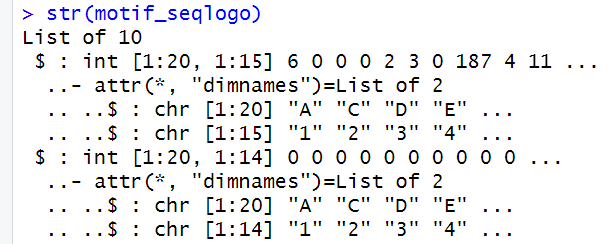
3.2 Visualization via ggseqlogo
Organize the input format required for ggseqlogo
# 提取 PPM 并转换为 pcm 对象
motif_seqlogo <- lapply(motifs, function(m) {
  # 提取 PPM 矩阵
  ppm <- m@motif

  # 将 PPM 转换为 PCM
  pcm <- ppm * m@nsites

  # 将列名设置为数字序列 "1", "2", ..., ncol(ppm)
  colnames(pcm) <- paste0(1:ncol(pcm))

  # 如果需要整数,直接对矩阵进行操作
  pcm <- round(pcm)
  storage.mode(pcm) <- "integer" # 强制矩阵的存储模式为整型

  # 返回矩阵
  return(pcm)
})

# 设置子列表的名字为 consensus
# names(motif_ggseqlogo) <- sapply(motifs, function(m) m@consensus)
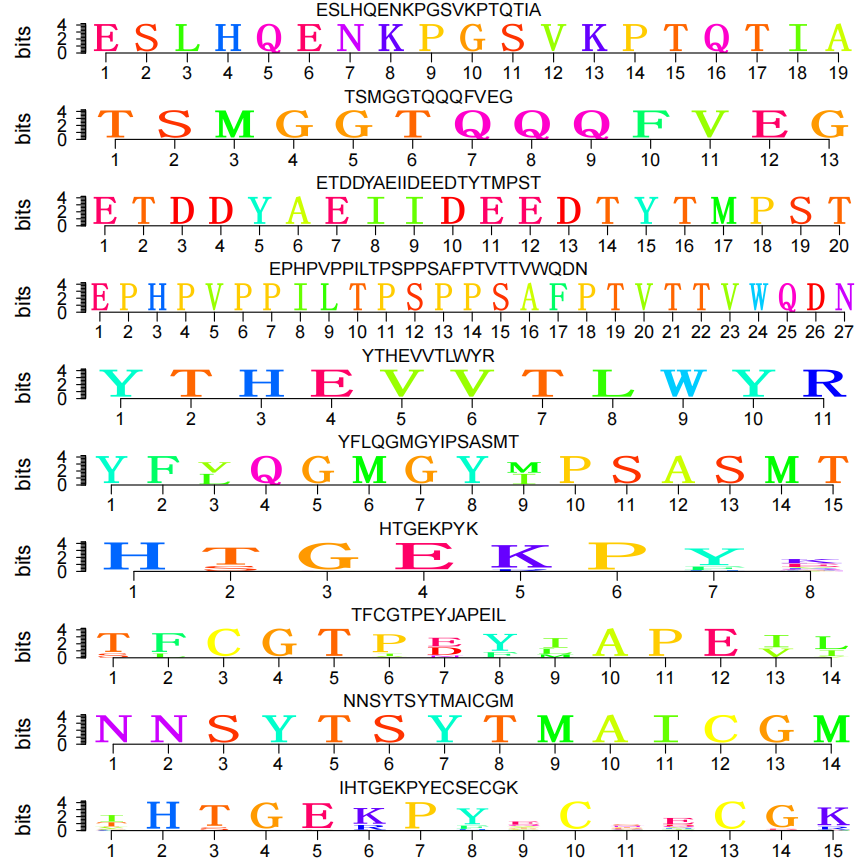
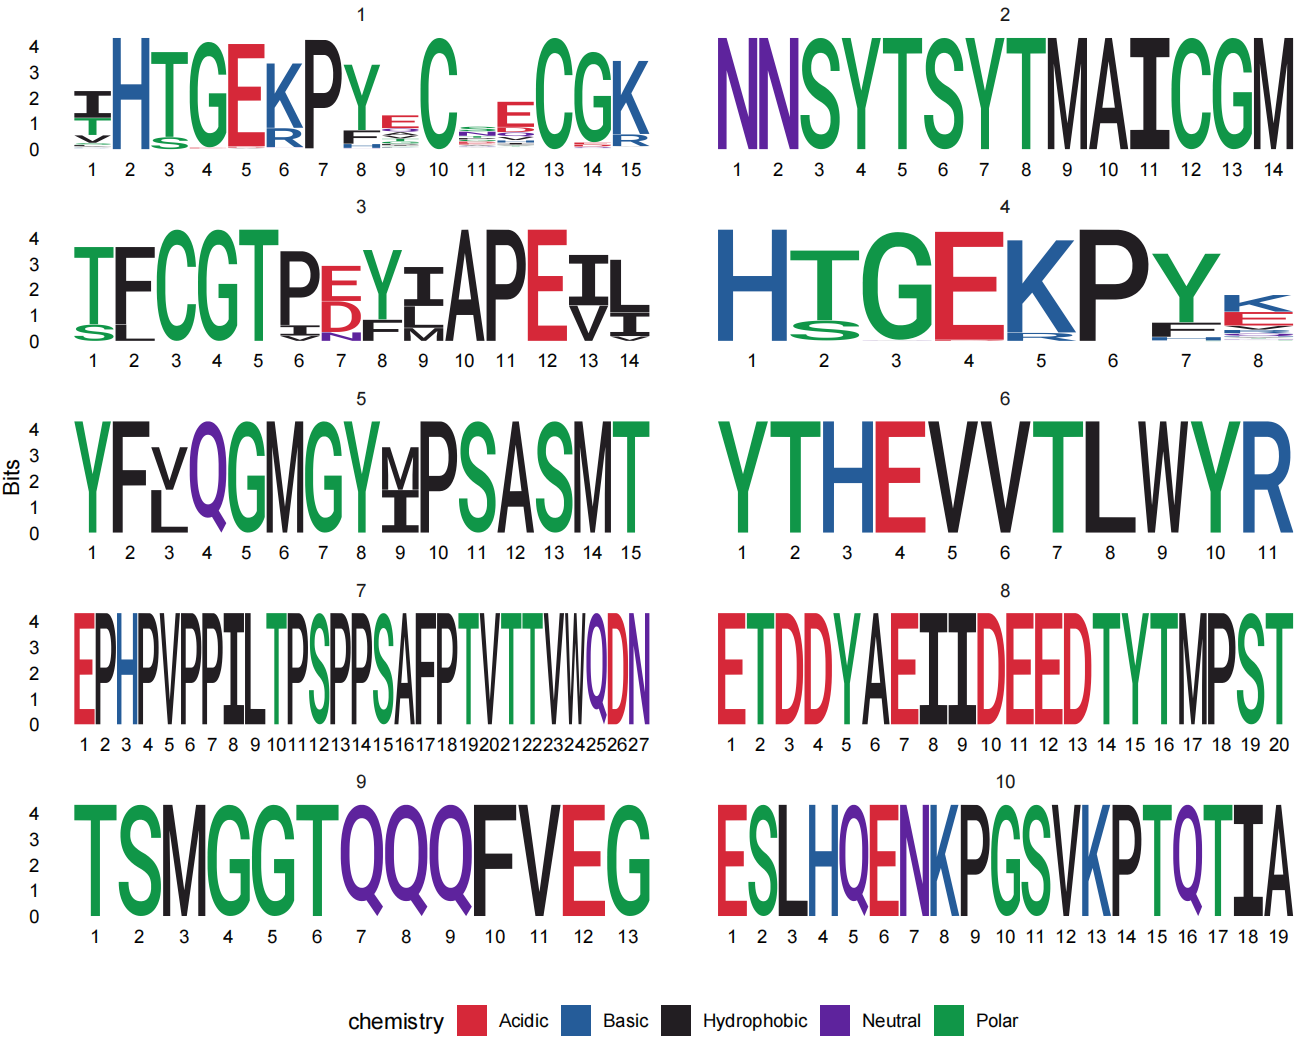
visualization
# plot
ggseqlogo(motif_seqlogo, method = "bits", facet = "wrap",ncol = 2) # method = bits / probability
# save
ggsave("motif_seqlogo.pdf", width = 10, height = 8,dpi = 600)